When AI Max came out last year we said the only honest way to judge it was a AI Max Lift Study at the whole-campaign level, not by the AI Max line item Google hands you in the report. This year we got to actually do that, on real accounts, with months of data. Short version: on our main test it came out neutral. Not a win. Not a loss. And we came very close to publishing two different wrong answers before we got there, which is honestly the more useful part of this post.
Some background on why we cared. Our Target CPA campaigns tend to land within about 10% of whatever target we give them. Once AI Max went on, the AI Max rows were coming in well above target, and the campaign as a whole was still on goal. Which made me suspicious. If the new traffic is expensive and the blend still hits target, something else in the campaign got cheaper to make room for it, so the line item can’t tell you anything by itself. You have to look at everything.
The Core Test
Our lead case is a national home services client running several Search campaigns, each split by service line types, each with its own AI Max on and off dates. Clean flip dates, nothing else changed at the same time, short conversion cycle, daily data. About as good a setup as you get outside a real experiment. I’ll call the campaigns A, B and C. A and B had AI Max on through the summer. C had it on earlier in the year and we switched it off May 26, and its own read at that flip was neutral too.
At six weeks, A looked slightly better on AI Max and B looked worse, small samples, nothing you’d bet on. Fine. We kept going.
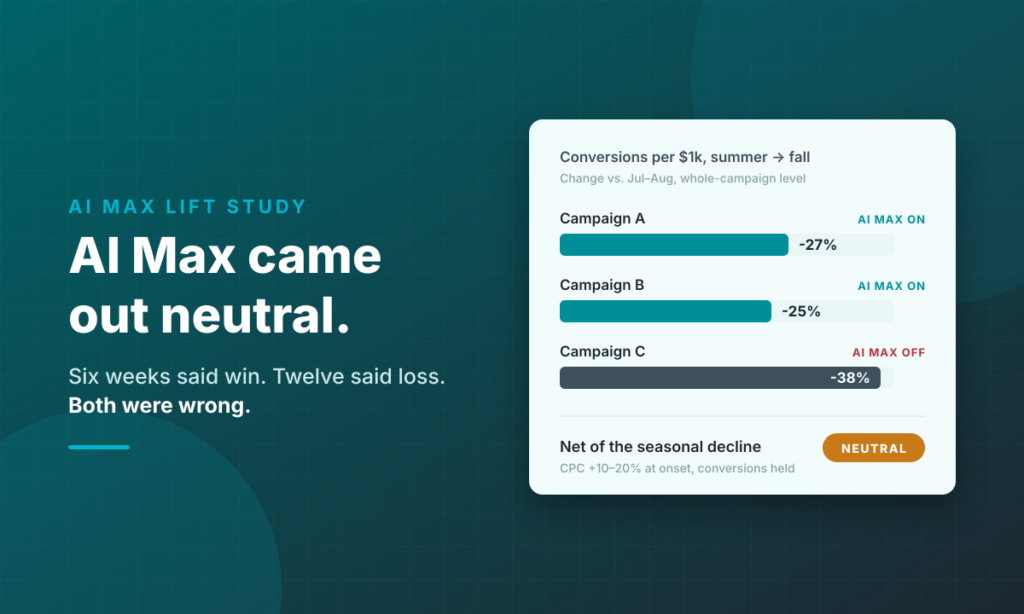
At twelve weeks it turned ugly. Campaign A’s conversions per thousand dollars were down 17% against its pre-period and CPA was up 21%. B was down 18% and up 22%. Hold spend constant and that worked out to 117 fewer conversions on A and 35 on B. On its face that’s AI Max getting worse once the learning phase wears off, and I’ll admit that’s the story I half expected, given everything we’d written about it. It also turned out to be wrong.
Campaign C is what saved us. It had AI Max off for that exact same summer-into-fall stretch, so it’s a control running the same calendar. If AI Max was the problem, A and B should drop and C should hold. C dropped the most. Conversions per thousand dollars down 38%, CPA up 62%. Fall is just a worse season for this client, everywhere, AI Max or not. Once you subtract C’s decline from A and B (comparing July and August to September and October), the AI Max campaigns actually held up a bit better than the one without it:
| Campaign | Metric | AI Max on | AI Max off (C) | Difference |
|---|---|---|---|---|
| A | Conv per $1k | -27% | -38% | +11 pts |
| A | CPA | +38% | +62% | -24 pts |
| B | Conv per $1k | -25% | -38% | +13 pts |
| B | CPA | +34% | +62% | -28 pts |
I wouldn’t call that a win either, and here’s why. C isn’t a perfect control. It’s a different line of business with its own searches, and it had a real demand drop earlier in the year, so it probably overstates the seasonal slide a little, which flatters AI Max in the comparison. Three treated campaigns, no randomization, and B is low volume. So we’re calling it neutral to maybe slightly positive. That’s what you’d expect if the decline was season and campaign fatigue rather than AI Max wearing out. Two weeks of a relearning campaign isn’t much, though.
The one thing that held up the whole way through was cost per click. When AI Max turns on, CPC steps up and sits roughly 10% to 20% above that campaign’s own baseline for the twelve weeks we measured. These results are consisten with other published studies of AI Max performance. That’s what query expansion looks like, getting into newer and pricier auctions. By fall CPC was falling with the season for everybody, so it looks more like a cost of getting started than a permanent tax. Still real money while it lasts.
A Second Client Test, For What It’s Worth
We ran the same framework on an ecommerce client with two brands, one campaign each, twelve weeks before and after. Less clean, and I want to be upfront about that, because spend roughly doubled at both flips. A pre/post can’t separate AI Max from a budget that doubled on the same day.
On the first brand AI Max actually served, about 11% of post-flip conversions. Revenue was up 178% and ROAS went from 3.05 to 3.71, which looks great until you see spend was up 128%, conversion rate fell 34%, CPA rose 44%, and the ROAS gain came from a handful of very large orders. The top three days were almost a third of the revenue. July was 5.87 ROAS. August was 2.71, below where it started.
The second brand is the one that really makes the point. The AI Max line item barely served at all, one conversion in twelve weeks, about 2% of the total and $150 in revenue. If you only looked at the line item you’d shrug and say it did nothing. The campaign as a whole went from $5.09 ROAS to $1.55, CPC up 38% and conversion rate down 36%. Whether that’s AI Max loosening matching on the existing keywords, the spend push, or both, we can’t fully say. But it’s exactly why the line item is the wrong place to look.
Different client, different business, and conversion rate dropped about 35% on both campaigns. That lines up with the CPC story from the core test: more reach into traffic that converts far worse. The difference is the core test had a control that showed most of the decline was the seasonal calendar. The second client didn’t have one, so we honestly can’t say how much of that is AI Max.
What Is The Takeaway?
So what are we doing with this learning. We are not scaling AI Max across every account and not ripping it out either. On the first client it’s staying on where it’s running, because neutral with a modest CPC premium is livable, and with Google moving campaigns into AI Max automatically now, knowing it’s roughly a wash is worth something. On the second client the first brand stays on under a closer watch and the second gets pulled back while we dig through search terms and change history.
Bigger lesson for us, and maybe for you: never read an AI Max test without a control campaign that has it off over the same dates. Six weeks told us one thing, twelve weeks told us the opposite, and both were wrong. Next step on our side is a more formal model across every campaign and every week, same idea with more structure. One gap we’ll own: this was measured campaign by campaign, not across the whole account, which is the cannibalization question we raised originally. That’s the next thing we want to look at as we expand account wide.